Infographics
Transforming complex data into visually engaging stories

Client
All
Type
Digital Design, Graphic Design, Communication Design
Industry
All
Role
Digital Designer
Introduction
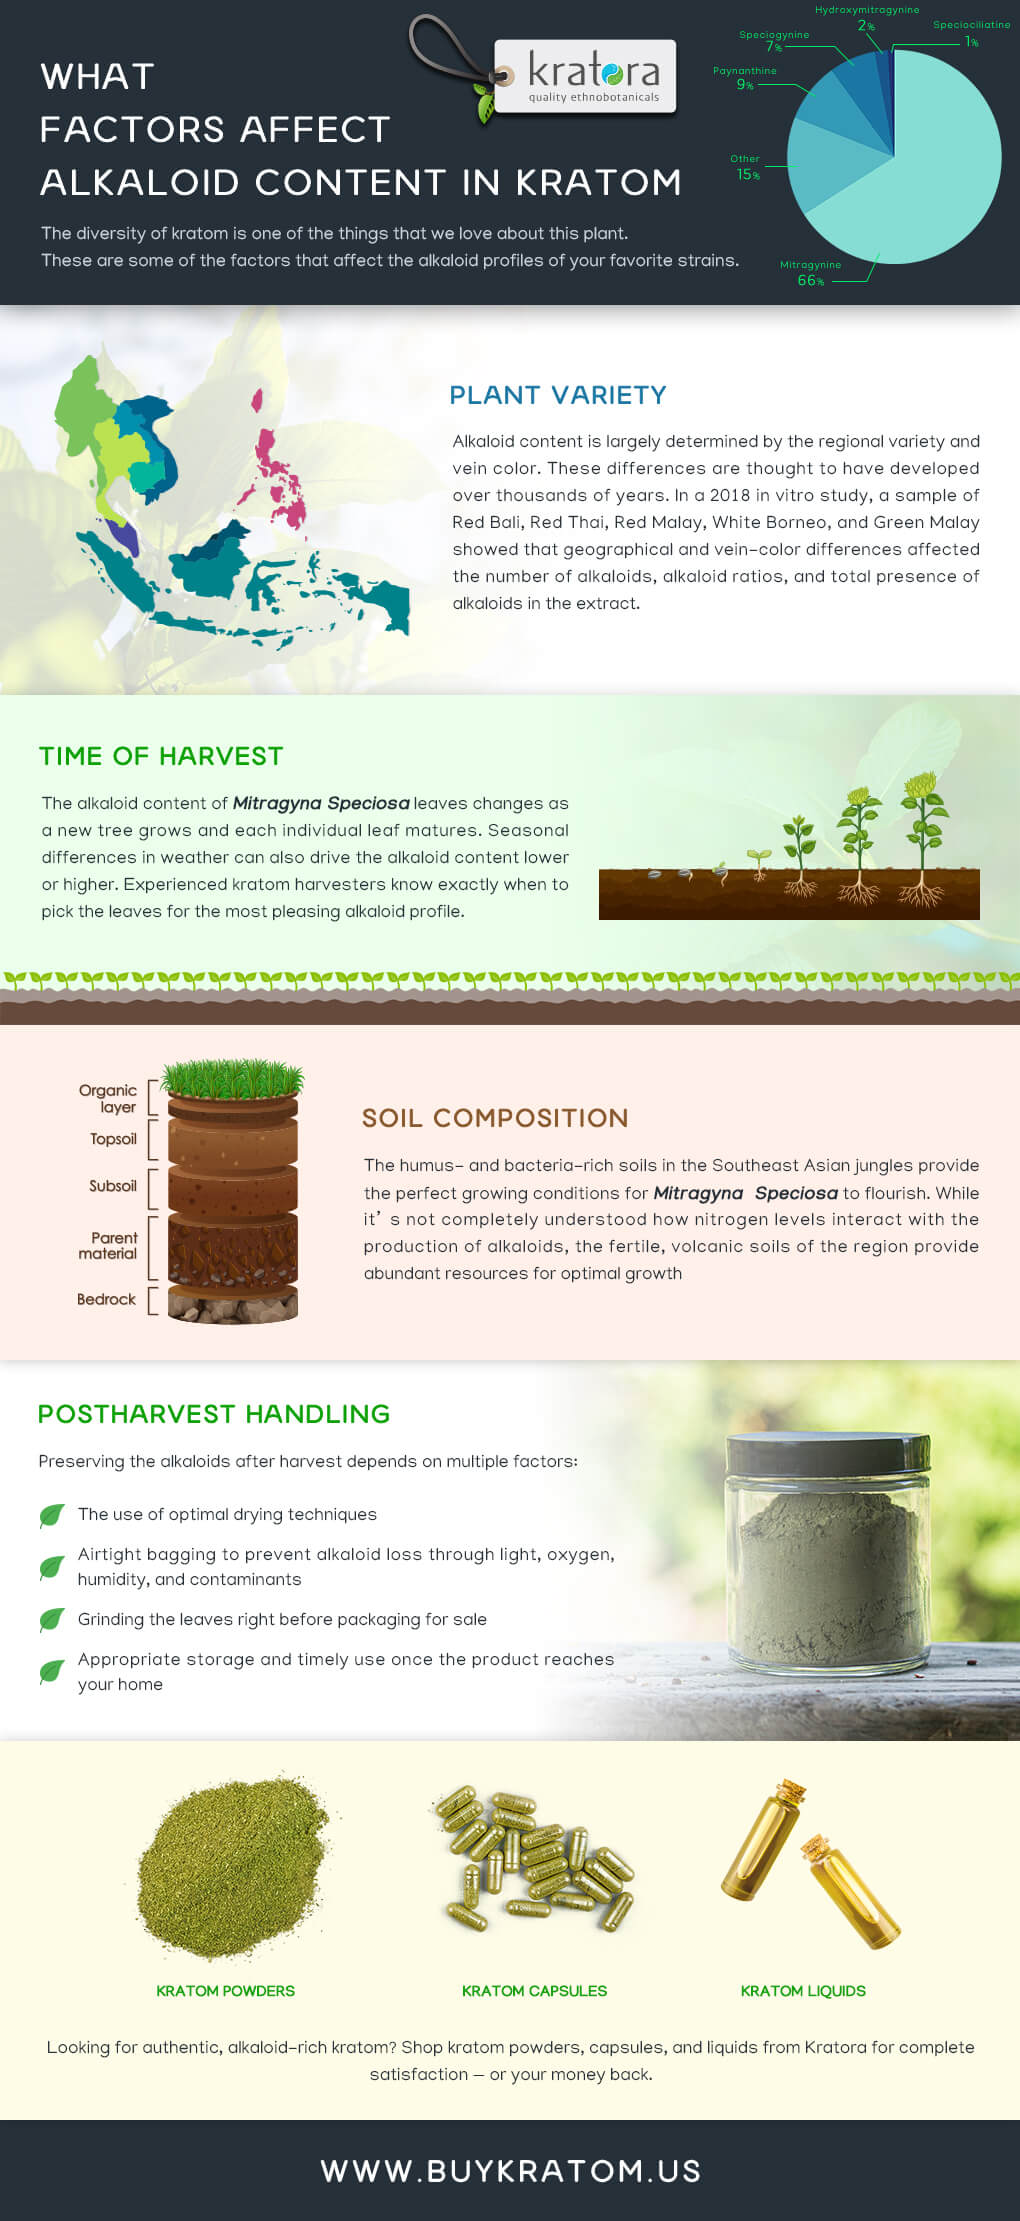
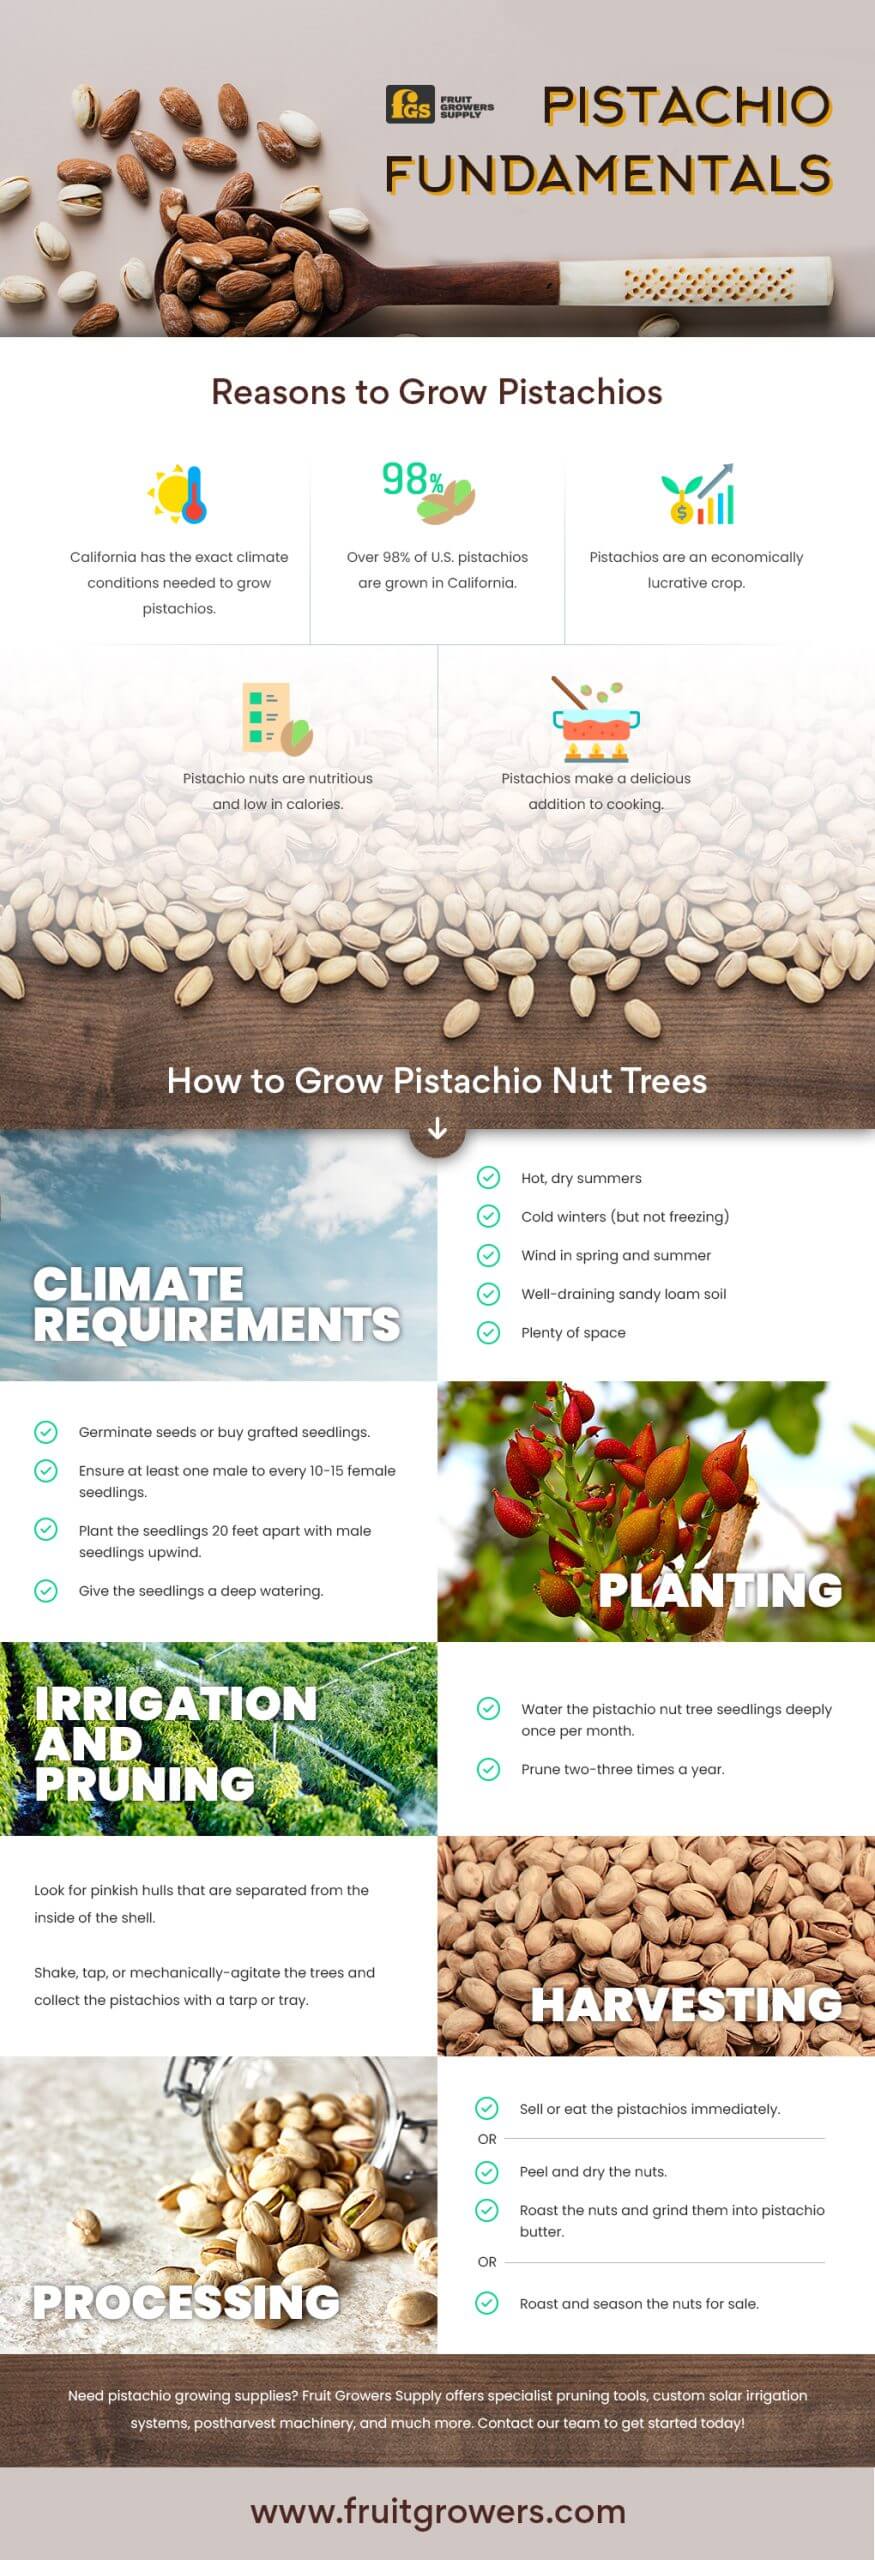
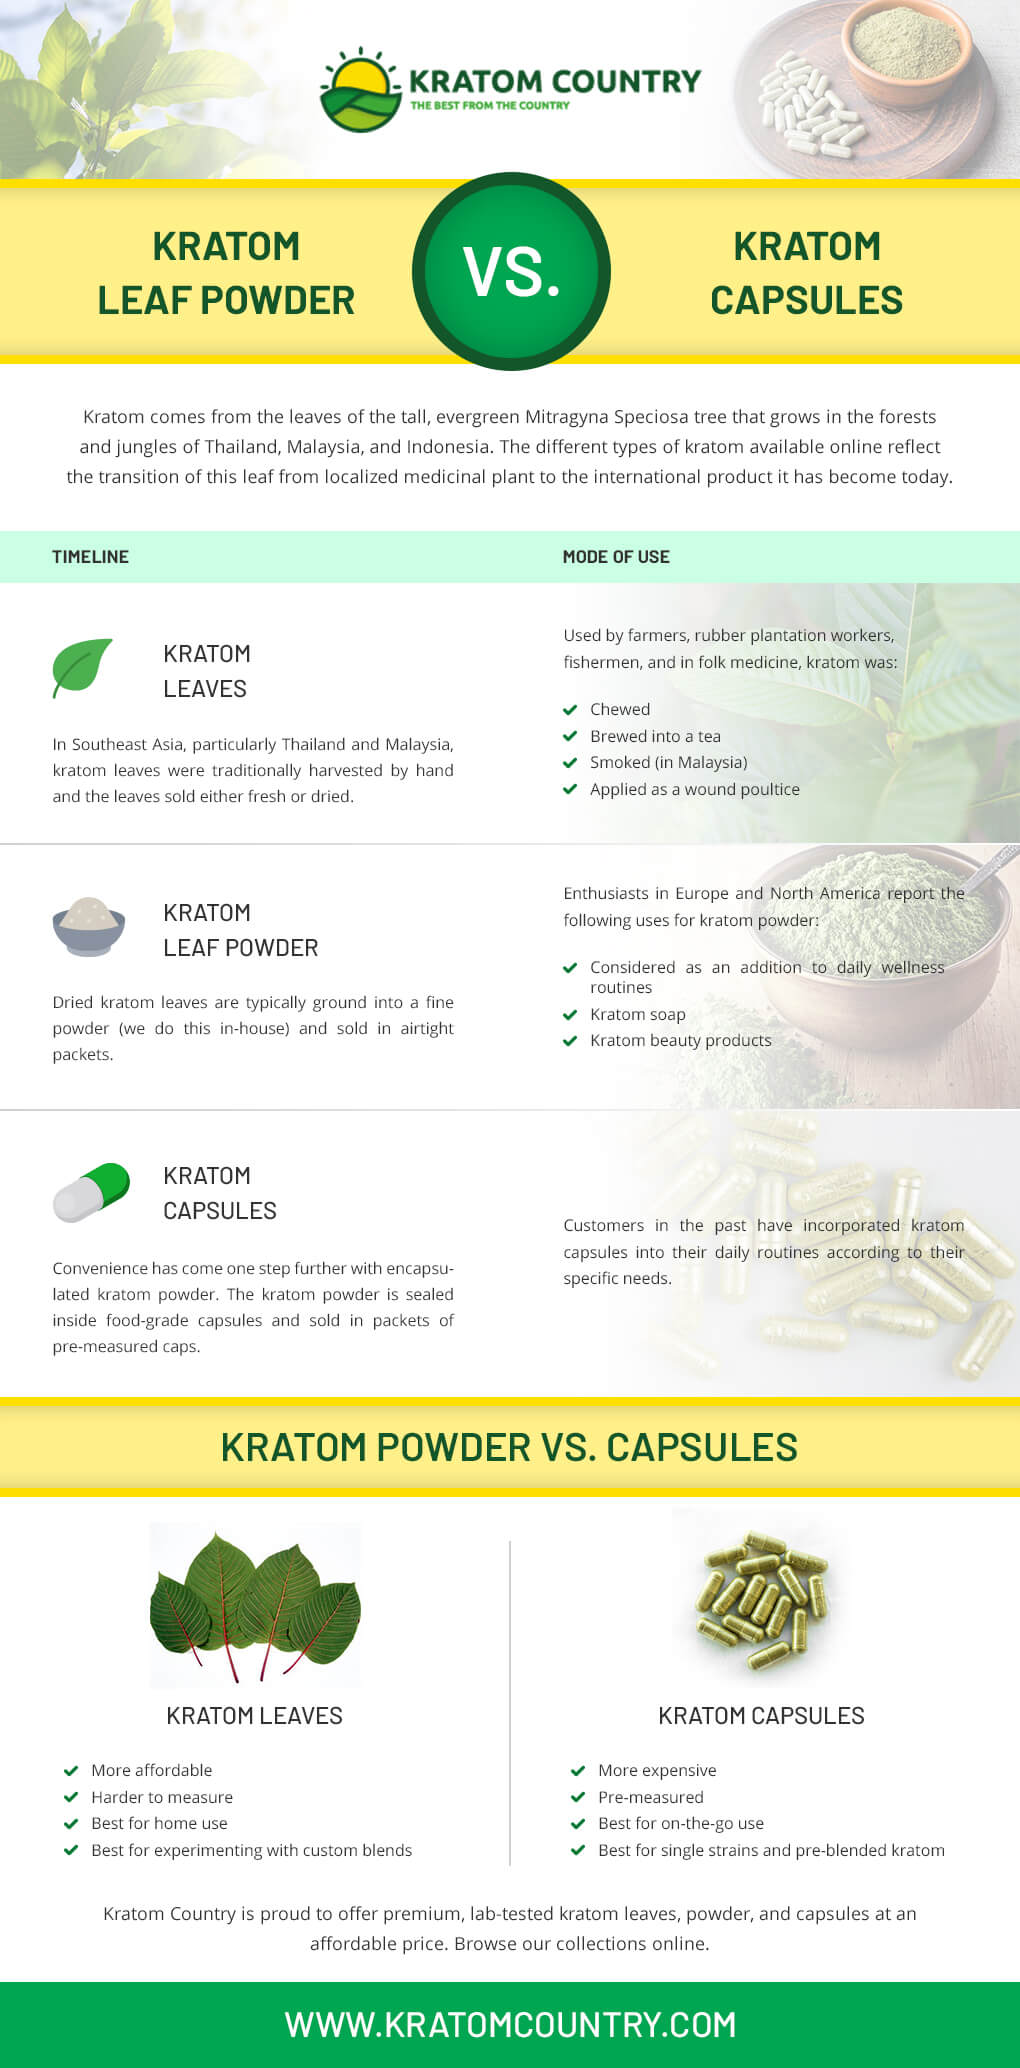
This Infographic project was focused on presenting complex information in a way that is clear, engaging, and easy to understand. As a Graphic/UI Designer, my role was to translate data and insights into a visual story that immediately communicates meaning to the audience.
The goal was to ensure that viewers could quickly grasp key points without being overwhelmed by details. By combining thoughtful layout, hierarchy, typography, and color coding, the infographic communicates information efficiently while keeping it visually appealing. This project highlights how design can simplify communication, making data memorable, shareable, and impactful.
Technologies

Project Description
The client needed a visual solution to convey a set of data-driven insights to stakeholders in a concise and engaging manner. My approach involved analyzing the data, identifying key messages, and planning a layout that guides the viewer’s eye logically through the story.
I applied principles of visual hierarchy, color theory, and typography to emphasize important points, while using icons, charts, and graphical elements to make abstract information concrete. Each section of the infographic was designed to support comprehension and retention, ensuring that complex concepts were presented in a digestible format.
The final design strikes a balance between clarity and creativity, helping the audience understand, interpret, and remember the information quickly. Compared to standard reports, this infographic stands out by turning raw data into a visual narrative that is both professional and compelling.